Customized Engineering Process Monitoring Website

Interactive OpenLayer map

Process Monitoring Chart

Admin Management Panel

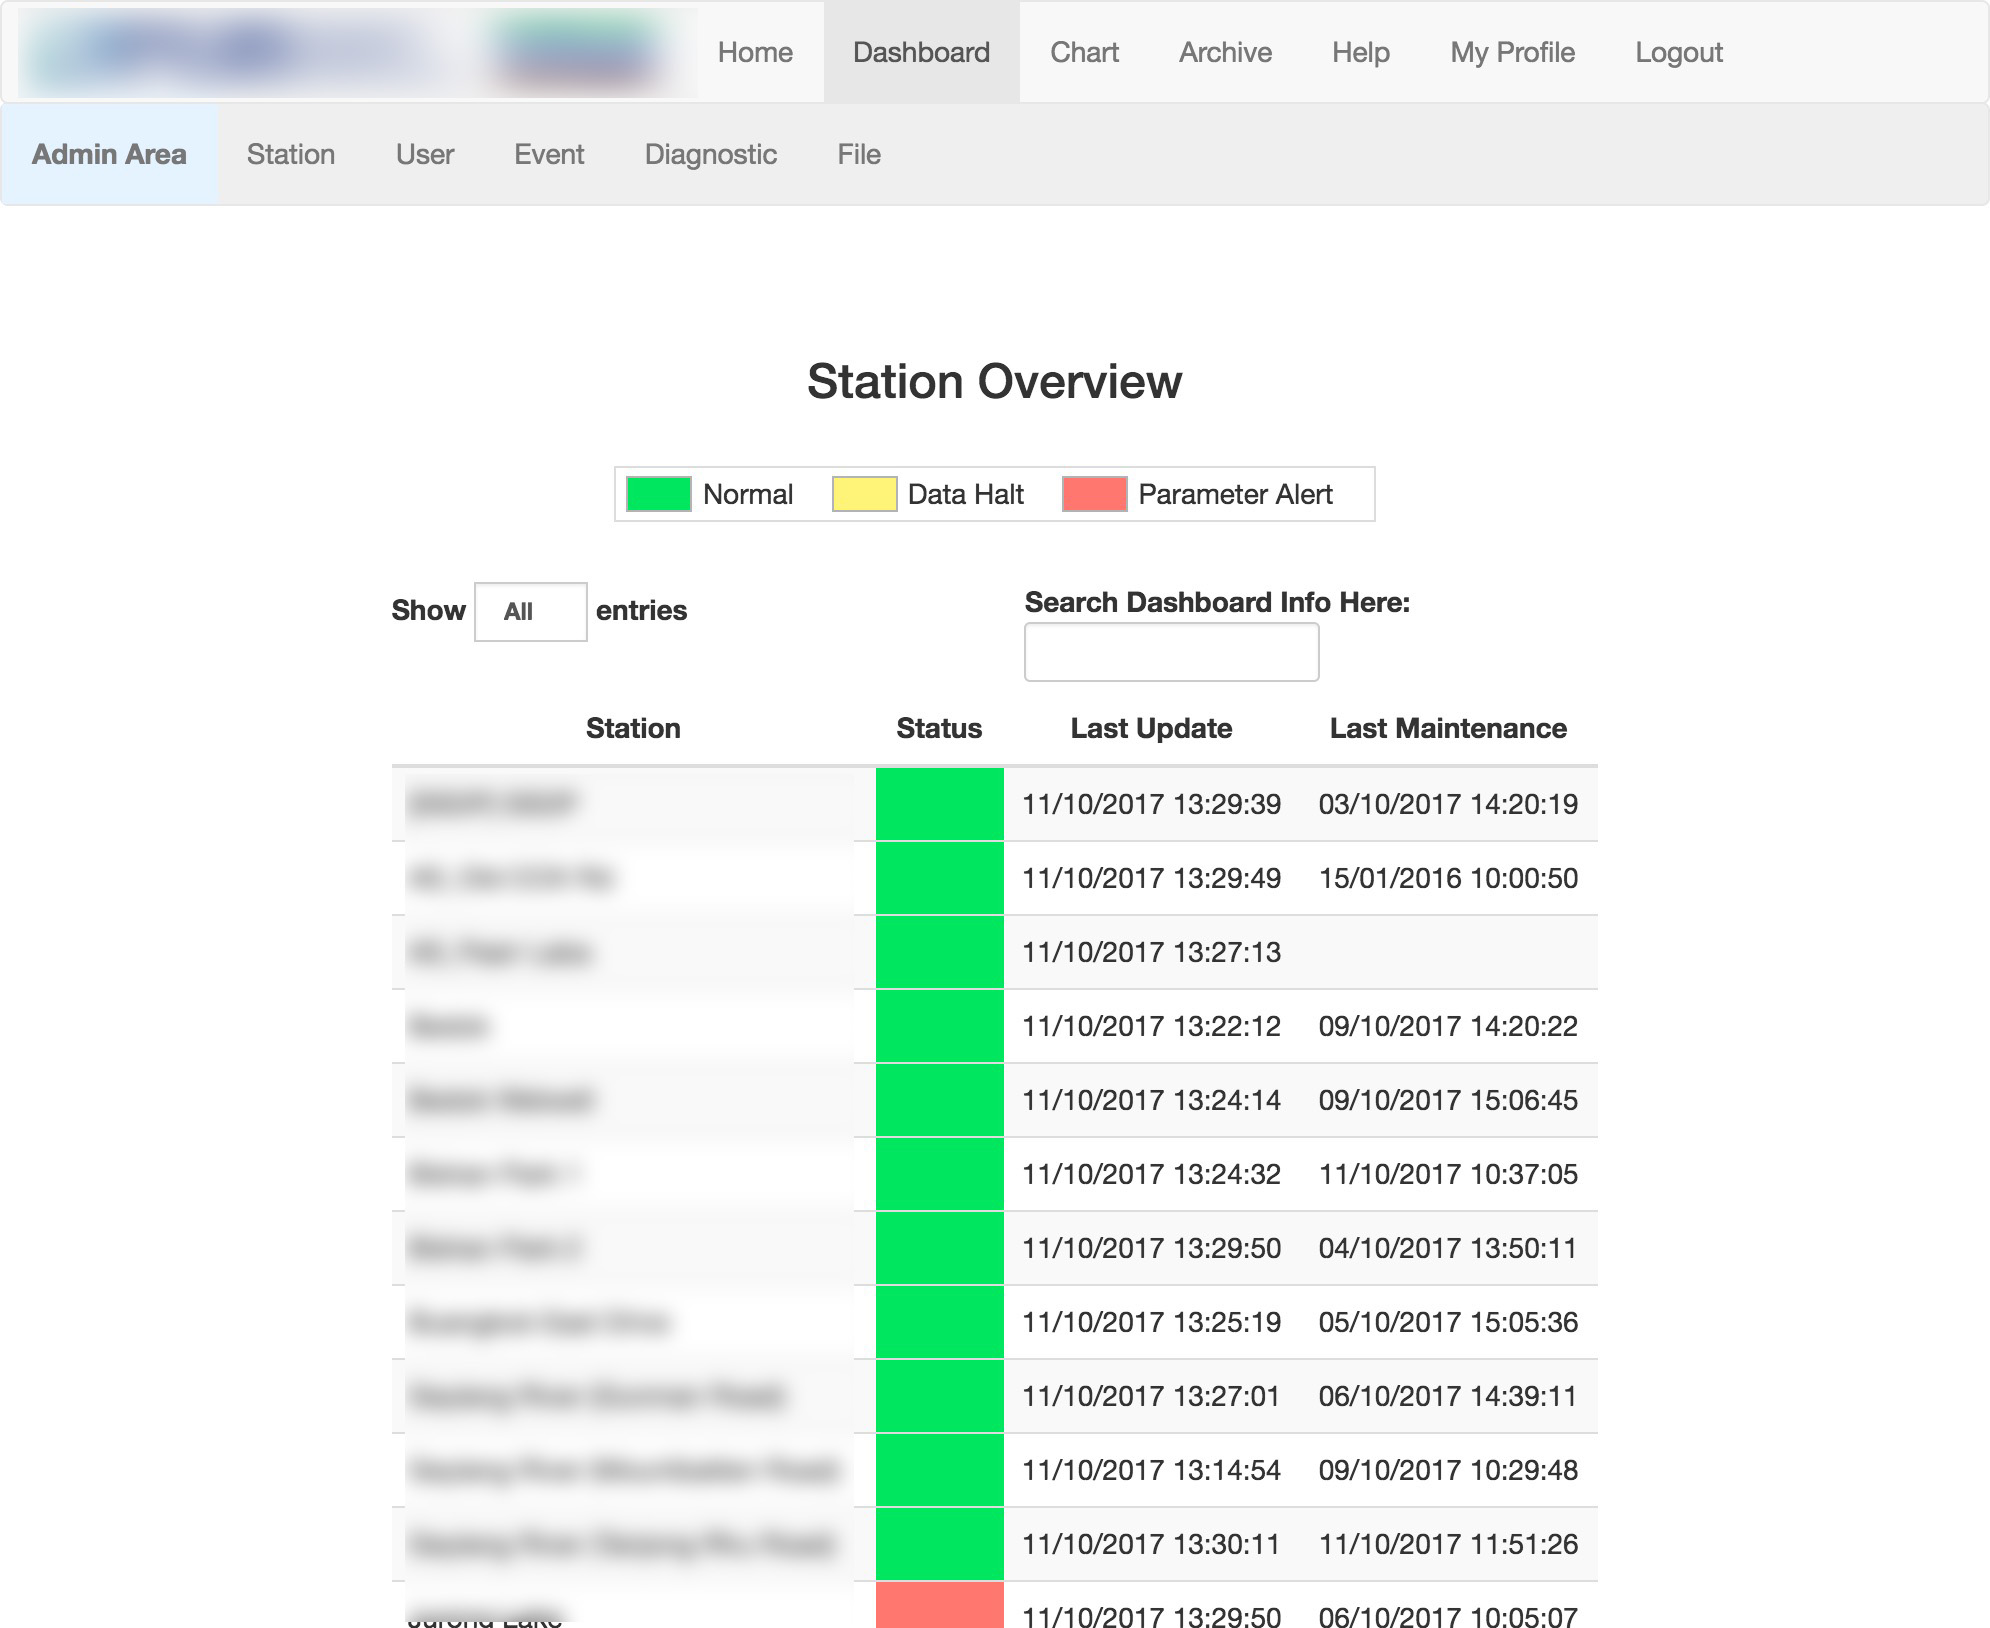
Admin Dashboard
Description
SysEng Pte. Ltd. is an engineering company specializing in providing remote real-time process monitoring systems. The monitoring systems usually involved two components, that is the hardware, and the software component. Data will be streamed from the on-site sensor wirelessly back to the server for processing and storing.
IT Wonders Web has been providing numerous business solutions for SysEng Pte. Ltd. since 2014. The project span varies from one month and up to eight months, depending on the nature of the project. We will briefly share one of the customized web development projects and the features IT Wonders Web has been delivered successfully.
Our Solutions
This is a fully customized web app built specifically for this project. Upon gathering the requirements and going through a few rounds of on-site and Skype discussion, we have implemented the following features

INTERACTIVE MAP WITH POP UP
We are initially using proprietary map system however the licensing cost is expensive. Therefore we switch to free and open source solution <a href="https://openlayers.org/">OpenLayer</a>. OpenLayers needs more coding effort however it also gives more flexibility to achieve whatever we want. The color of the markers on the map reflects the current real-time status of the monitored system. Clicking on the marker will pop up a status box with a link to navigate to chart page to see the details data.

SMART CHART SYSTEM
/chart system shows multiple streams of data based on different sensors. This is a data-intensive system, therefore user experience is one of the important factors we have to properly consider in order to ease the operator workload. This app will alert the operator if the data went below or above the permitted threshold value. The alert comes in a few forms, be it chart flashing on the web, SMS, or email notification. This is due to the fact that the monitored system is critical and sensitive, therefore the user needs to be alerted as soon as possible for a faulty scenario. The user can also download the Excel sheet based on the selected period. Backend server will then process the request on the fly. The downloaded Excel has multiple sheets of data together with chart plotted based on the data.

ADMIN MANAGEMENT PANEL
This is a multi-user system. First of all, the monitored system needs to be grouped based on the location. Then each user will be assigned to a different group which has access to view different monitored sites. User and site/system status can be set to active or inactive to ban a user from accessing or decommission an old site/ an old system. This user system is built specifically based on the given requirements.